


The 2024-2025 Broadway season was a banner year for gross and attendance. An aggregate gross of $1.9 billion rendered 2024-2025 the highest-grossing season on record, and the 14.7 million admissions earned the season the title of second-best attended.
This is no doubt buoyed in part by the record-high grosses for several shows this season; shows like “The Picture of Dorian Gray,” “All In: Comedy About Love,” “Oh, Mary!” and more have broken various house records at their respective theaters. And, of course, shows like “Good Night, and Good Luck” and “Othello” (which both ended their runs on June 8) have made headlines, with outlets shouting that tickets are going for $900 a piece. But is that an accurate snapshot of overall Broadway ticket costs — or even the paid admission for every seat to those specific shows?
Weekly grosses statistics, including average paid admission figures, can be seen in the industry’s weekly grosses, compiled and published by the Broadway League, the national trade association for the industry. Broadway News used these numbers to investigate.
Three shows consistently landed in the three top spots for the highest average paid admission for the final four weeks of the 2024-2025 season (weeks ending May 4 through 25): the Main Stem’s third revival of “Glengarry Glen Ross,” featuring Bill Burr, Kieran Culkin and Bob Odenkirk, the George Clooney vehicle “Good Night, and Good Luck” and the revival of “Othello” starring Denzel Washington and Jake Gyllenhaal.
For the week ending May 25, “Good Night” had an average paid admission of $337.59. “Othello” posted an average paid admission of $398.79. And “Glengarry” $239.98. (So, it’s first important to point out that while some tickets may be sold for those headline figures, the average is nowhere near that amount.) While these numbers are notable, especially with three nonmusical plays topping the weekly list of average paid admission, they are not indicative of the full slate of currently running productions. The average paid admission across all Broadway shows for that same week was $138.20, which includes those top earners.
Broadway News took a closer look to see how much the average theatergoer pays to see a Broadway show.
What exactly is average paid admission?
First, it’s important to define average paid admission. Average paid admission is a simple calculation of dividing a show’s gross by its attendance, and it tells you exactly that: the average amount paid per admission to the theater. This is different from the often-conflated term “average ticket price,” which would be the average price listed for every ticket put on sale (which is data that is not publicly available). Average paid admission accounts for discounted ticket prices and, for the last 15 years, includes complimentary tickets.
Season average paid admission
Starting with a bird’s-eye view, the average amount paid per theater visit in 2024-2025 season was $129.12, well below the average amount paid for the aforementioned outliers. While this number is approximately $3.90 higher than the average paid admission seen in 2023-2024 ($125.27), it is only $0.69 more than the average paid during 2022-2023 ($128.43).
Removing the three outliers (“Glengarry,” “Good Night” and “Othello”) from the equation lowers this season’s average admission by $4.08 to $125.03 which is $3.40 less than 2022-2023.
Week-by-week comparison
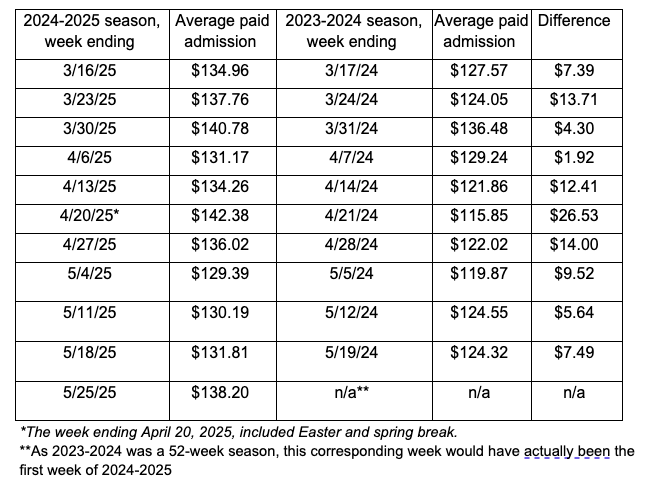
The impact of this trio of shows is more visible when taking a more focused, week-by-week examination. We compared the weeks from this season that included all three of the aforementioned shows to the same weeks last season. (While “Othello” began previews during the week ending March 2, the other two did not begin until the week ending March 16.) The average paid admission was higher for every week in 2025 compared to 2024. But, the difference in the overall average paid admission ranges from $1.92 to $14.00 — with one outlier of $26.53 for week 48 (ending April 20, which encompassed Easter and spring break for many).
Average paid admission for last 11 weeks of the season
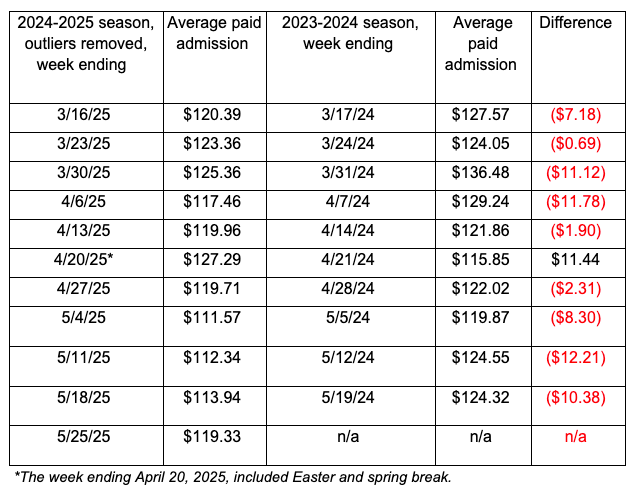
Removing the three outlying shows offers a different perspective. In each of these weeks (save once again for the April 20 week), this season’s average paid admission is actually less than the comparable weeks in 2023-2024.
Average paid admission for last 11 weeks of the season, without 2024-2025 outliers
Past season comparisons
Now let’s take a look back over several years, including one season before the pandemic, a season 10 years ago and a season 20 years ago, both with and without respective outliers.
For post-pandemic seasons, we defined an outlier as a show with an average paid admission greater than $200 for at least 50 percent of the weeks that the show played during that season. For the 2018-2019 season, the threshold remained $200. For 2014-2015, the cut-off was adjusted to $175 for at least half of a show’s playing weeks during the season, and for 2004-2005, $90.
The outliers for each season were as follows:
2024-2025: “Glengarry Glen Ross,” “Good Night, and Good Luck,” “Merrily We Roll Along” and “Othello”
2023-2024: “Cabaret” and “Merrily We Roll Along”
2022-2023: “Plaza Suite” and “The Music Man”
2021-2022: “Hamilton,” “Plaza Suite” and “The Music Man”
2018-2019: “Hamilton” and “Springsteen on Broadway”
2014-2015: “The Book of Mormon”
2004-2005: “700 Sundays”
Average paid admission over the past 20 years
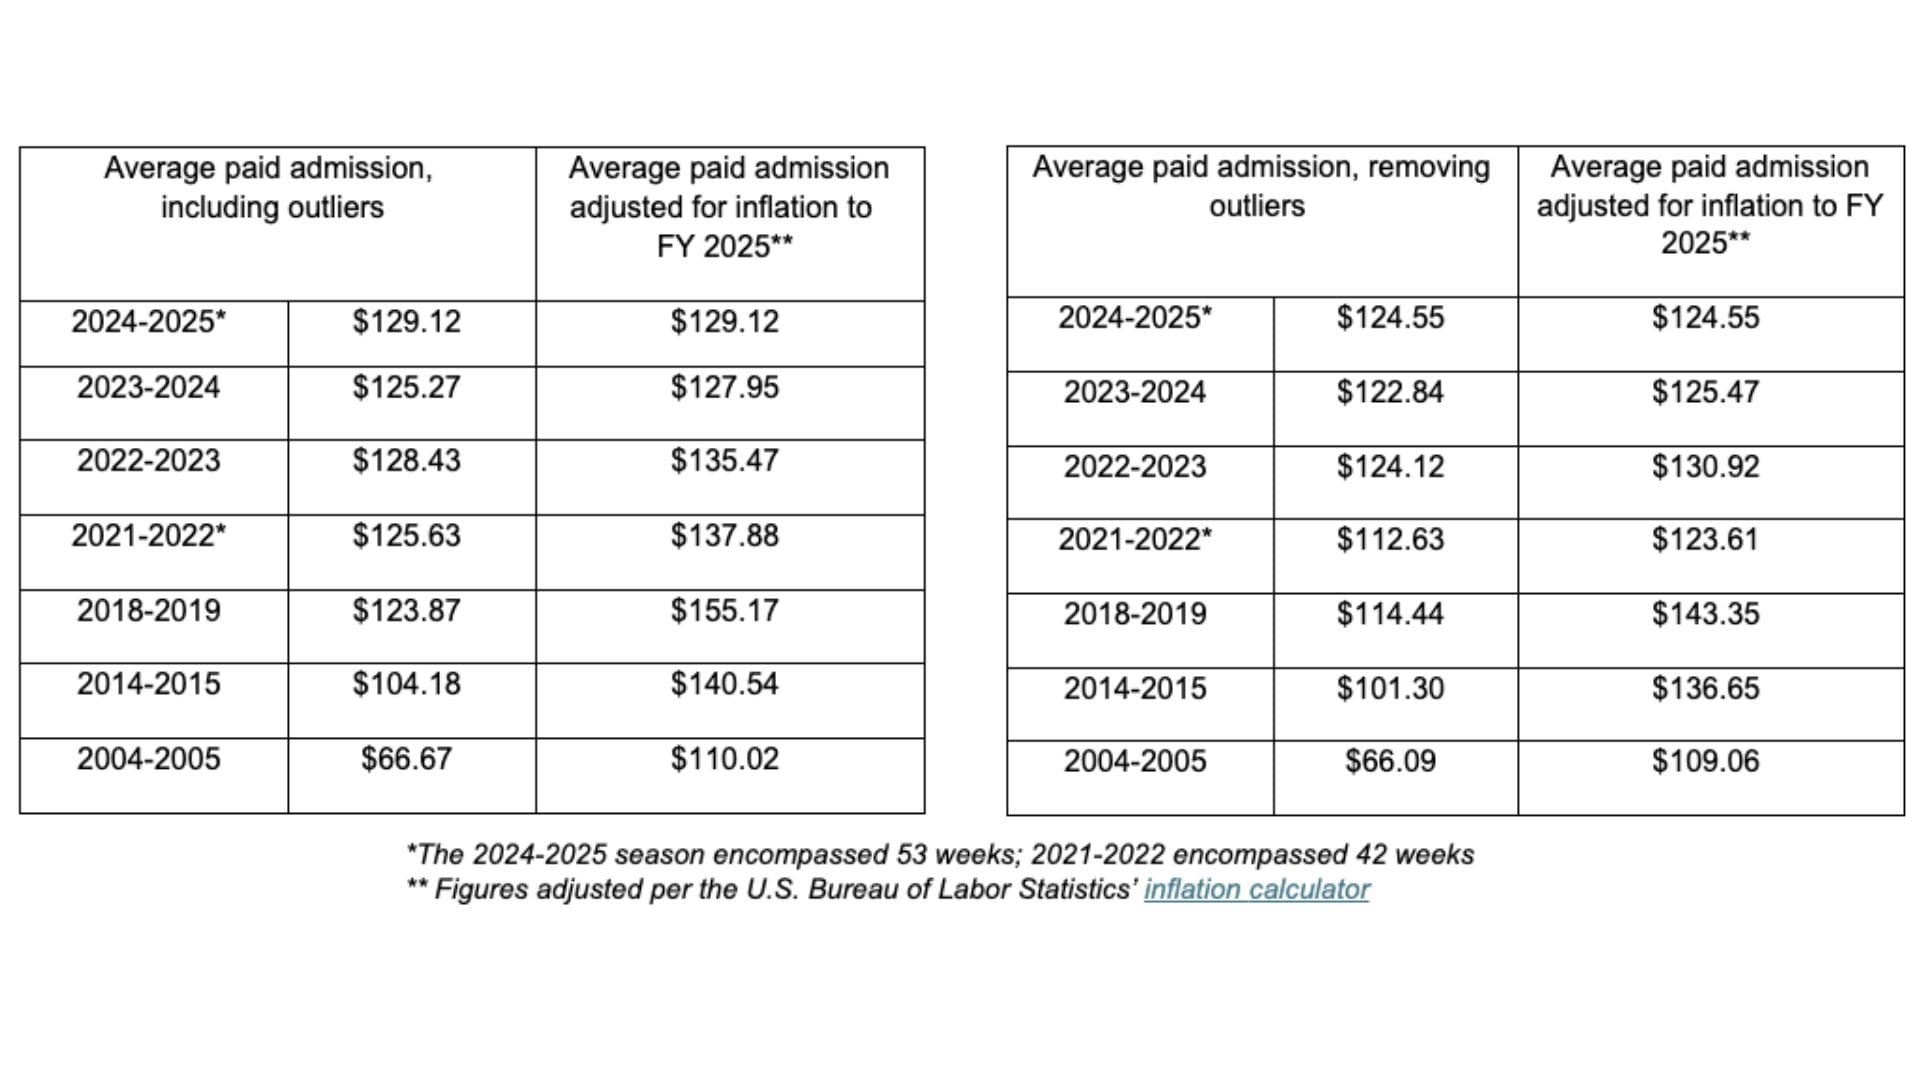
Adjusting for inflation, 2024-2025’s average paid admission, both with and without the seasonal outliers, is significantly less than the average paid admission of the 2018-2019 season, the previous record holder for gross.
Most shows command an admission price less than $150
These statistics indicate the aforementioned outlier shows are indeed just that. And every season has its unique circumstances, including its own set of outliers.
“Hamilton” posted equally noteworthy average paid admissions during its second year on Broadway, surpassing $300 for the first time during the week ending Nov. 27, 2016 — and it wouldn’t be the last time that price was paid. Of the 52 weeks that “Springsteen on Broadway” played the Rialto in 2017 and 2018, all but three saw an average paid admission in excess of $500. Going further back, during every week of its seven-week limited run in 2013, “Manilow on Broadway” posted a premium price of $700, which was over $200 more the premium of any other show at the time; however the concert never garnered a weekly average paid admission greater than $155. Moreover, none of these prices reflected the average paid admission across Broadway.
In fact, in all but one week of the 11 weeks that included the big three in 2024-2025, over 70 percent of all shows playing on Broadway each week had an average paid admission less than $150. Moreover, for three of those weeks, 82.5 percent of shows tallied an average paid admission under $150.
While the more robust average admission numbers get attention in the press, it is important to remember that another end of the spectrum indeed exists: In 2025, the majority of Broadway shows are welcoming patrons at a cost less than $150 per ticket.